
BPA Markov Chain Model for Proportion Married Assumptions
Model Overview
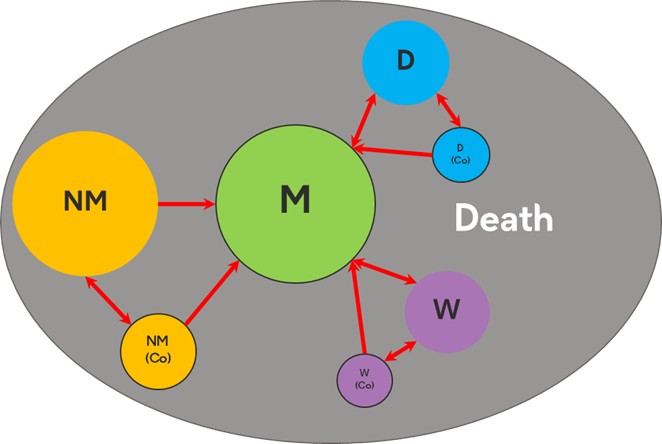
The Life2 Proportion Married Assumptions model applies Markov Chain methodology to ONS England and Wales population data (marital status, marriage/divorce rates) to predict probabilities of pension scheme members transitioning between states: Never Married (NM), Married (M), Divorced (D), Widowed (W), Cohabiting (Co), and Deceased (Dth).
Initial Status Determination
Initial marital status is determined using three data sources prioritized as: Write-Out (WO) survey > LexisNexis (LN) trace > Administration Data (AD).
LexisNexis Marital Status Codes
| LN Code | Marital Status | BPA Scheme % |
|---|---|---|
| LN 1 | Married | 40% - 50% |
| LN 2 | Living as Married | 8% - 10% |
| LN 3 | Living with Family | 4% - 8% |
| LN 4 | Same-Sex Cohabitee | 0% - 2% |
| LN 5 | Multi Household | 2% - 5% |
| LN 6 | Living Alone | 10% - 20% |
| LN 7 | Unknown | 10% - 25% |
| LN 8 | Widowed | 0% - 1% |
| LN 9 | Invalid | 0% |
Transition Matrix & Probability Calculations
Key Transition Rate Analysis
Marriage Rates
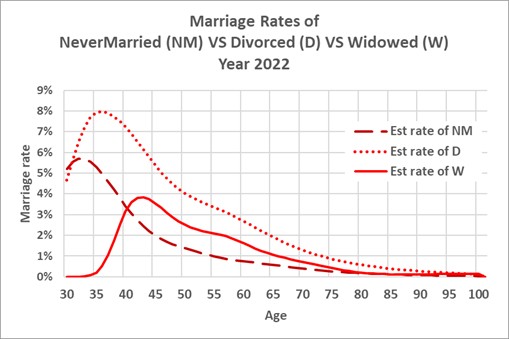
Remarriage rates for divorced individuals are 60% higher than never-married cohorts. Cohabiting individuals are 1.5× more likely to marry.
Divorce Rates
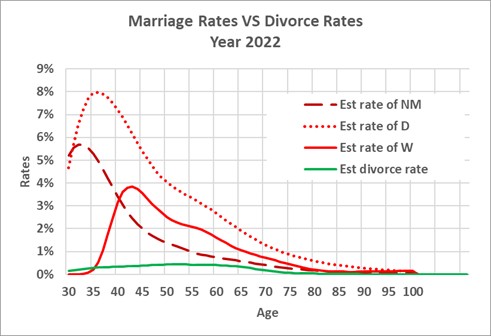
The 2020 Divorce Reform Act introduced a 20-week cooling-off period, potentially reducing impulsive divorces.
Mortality Adjustments
| Marital Status | 20-64 (Male) | 65+ (Male) |
|---|---|---|
| Married | 53% | 76% |
| Never Married | 148% | 174% |
| Divorced | 135% | 167% |
| Widowed | 120% | 121% |
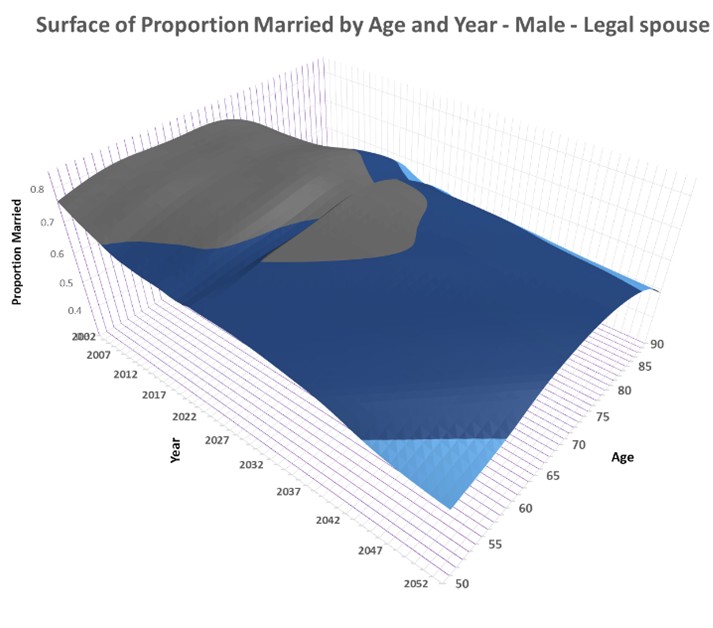
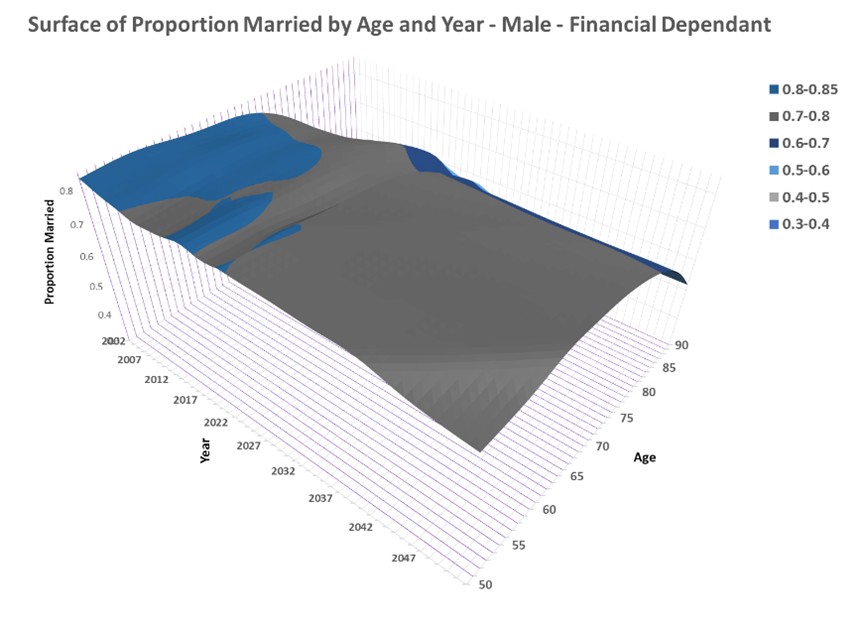
Projection Examples
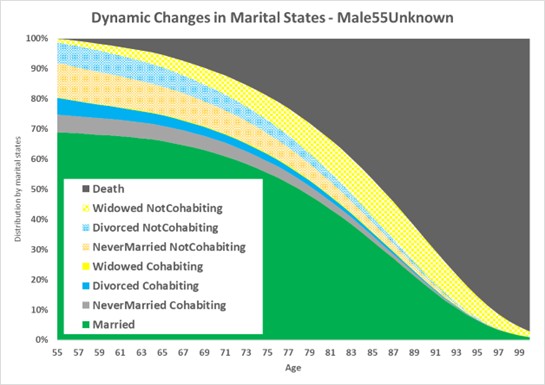
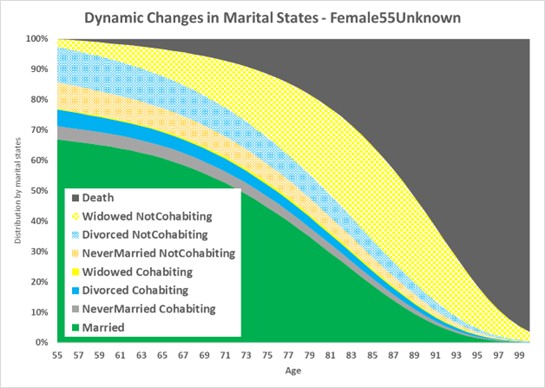
Females show higher widowhood probabilities (yellow areas) due to lower mortality rates compared to males.
Conclusion
Marriage rates have declined by 35% over 50 years, while cohabitation rose from 19.7% (2012) to 22.7% (2022). Traditional 100% married assumption at age 55 is unrealistic – MMA projections better capture divorce/remarriage dynamics.